

From scattered spreadsheets to one living evidence library
Pre-discovery research starts with in-depth searches of the literature and public data repositories. Assembling that evidence is slow, and findings too often end up in separate spreadsheets with poor version control and infrequent updates.
Aevidence changes all that. Its specialized discovery apps let you explore evidence from public and internal sources, and gather, organize, update, and share it to:
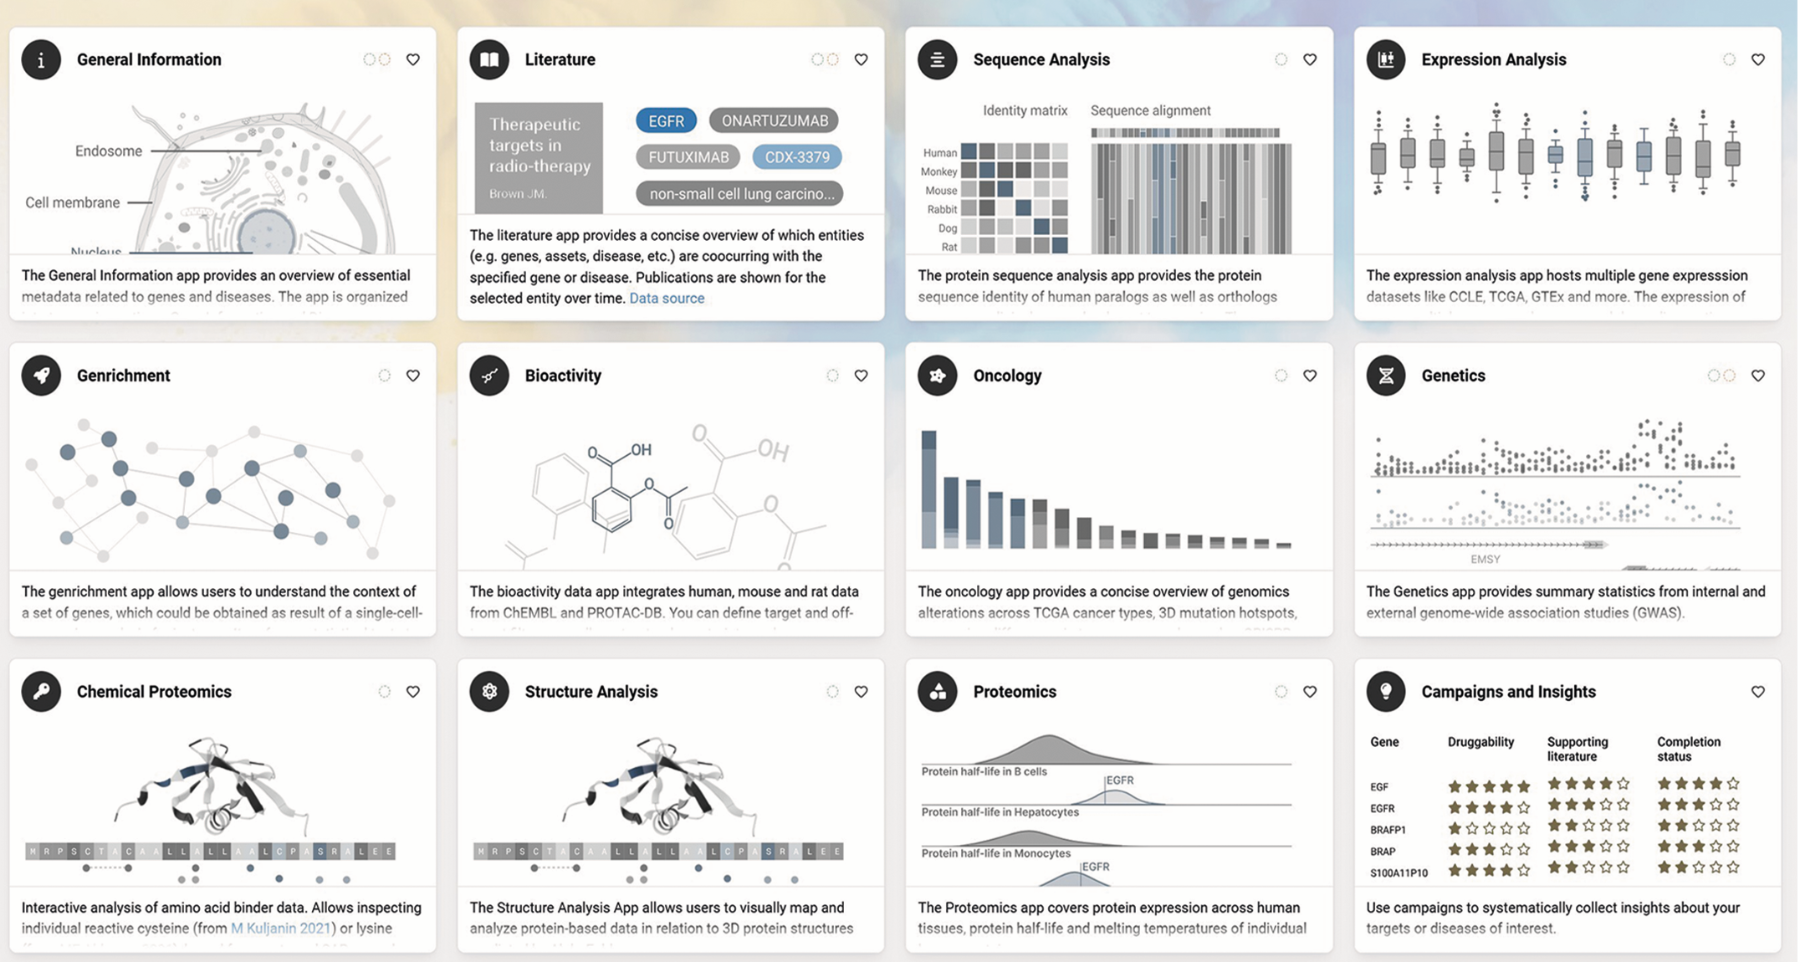
Interactive, intuitive, inspiring
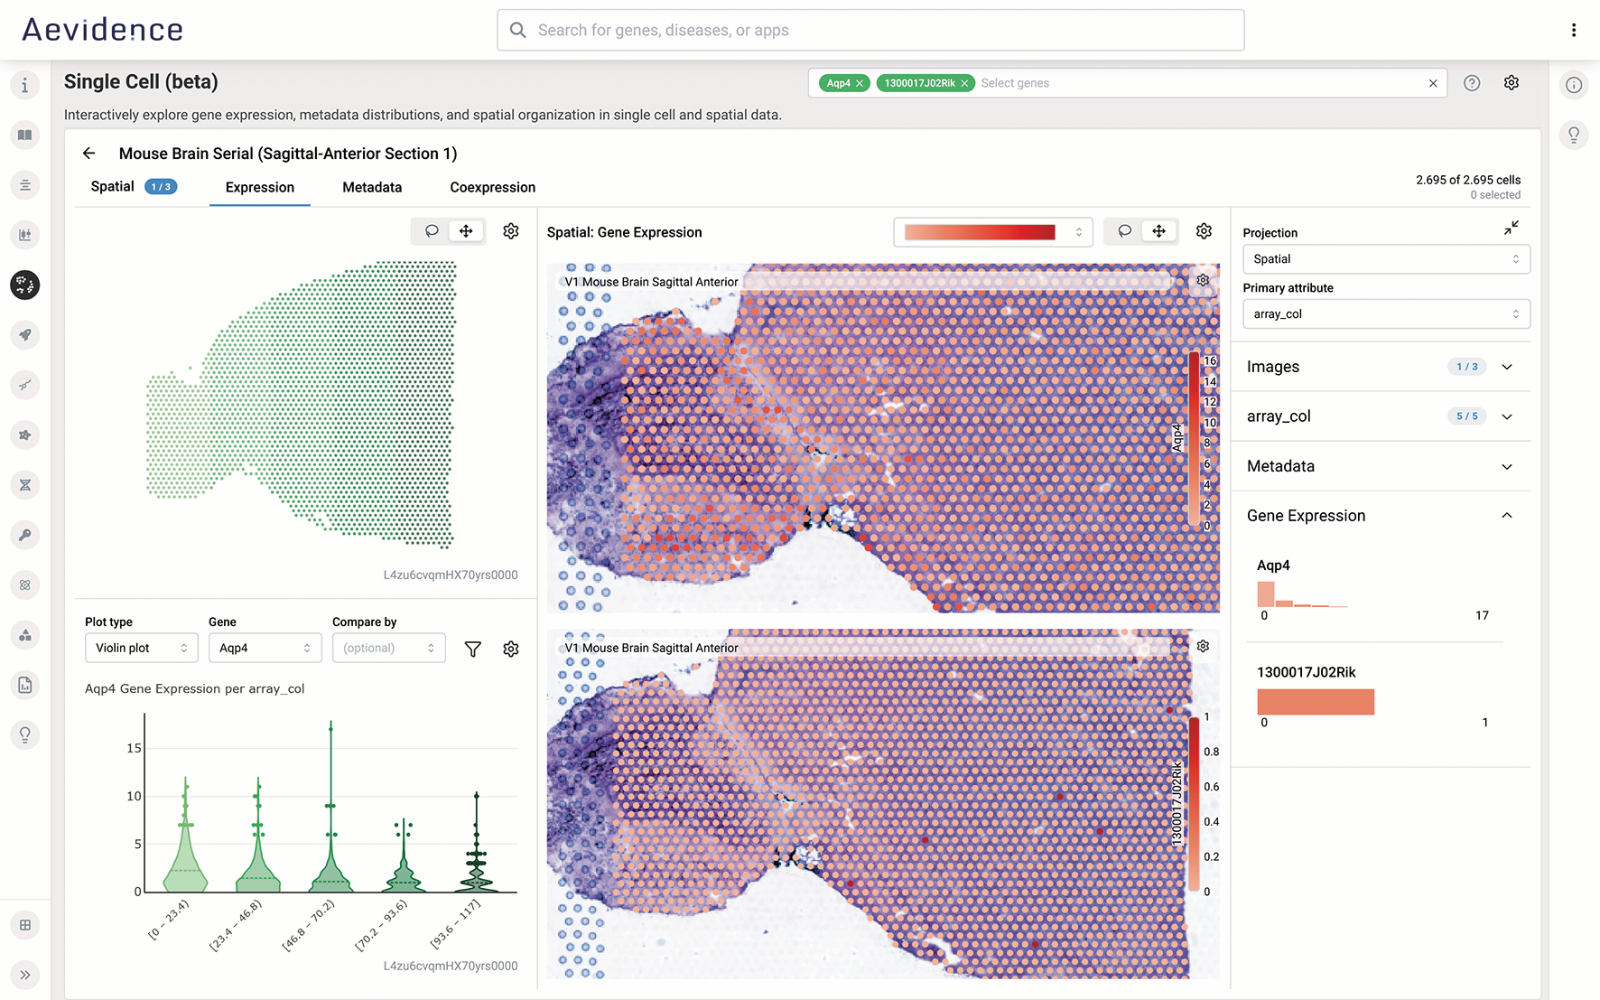
Single cell
A high-performance, interactive environment for exploring complex transcriptomic data, spatial data, and high-dimensional cellular maps, with lasso selection synchronized across UMAPs and tissue slides.
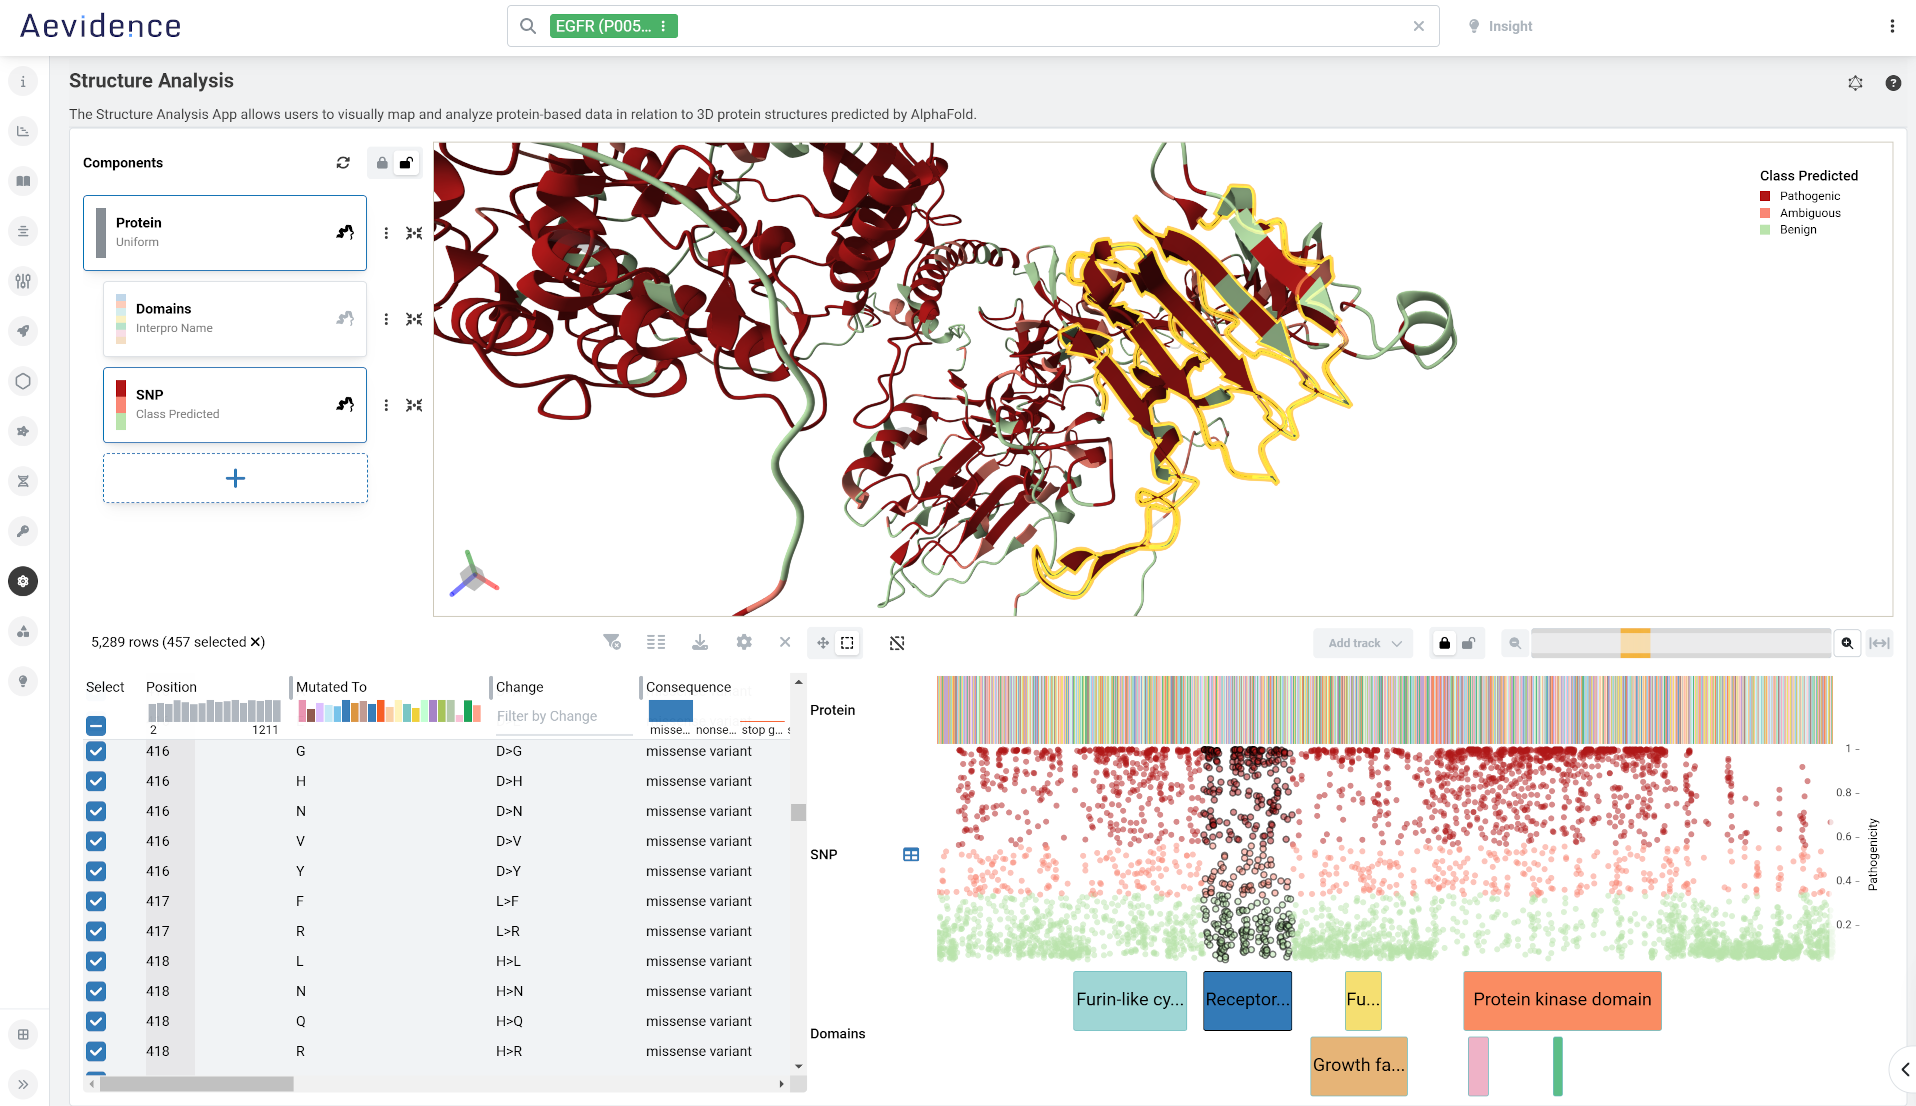
Structural bioinformatics
Visualize 3D structures and explore underlying sequences of experimentally determined and computed proteins in the RCSB protein data bank. Understanding the 3D structure of a biological macromolecule is critical for discerning its role in health, disease, and therapeutics.
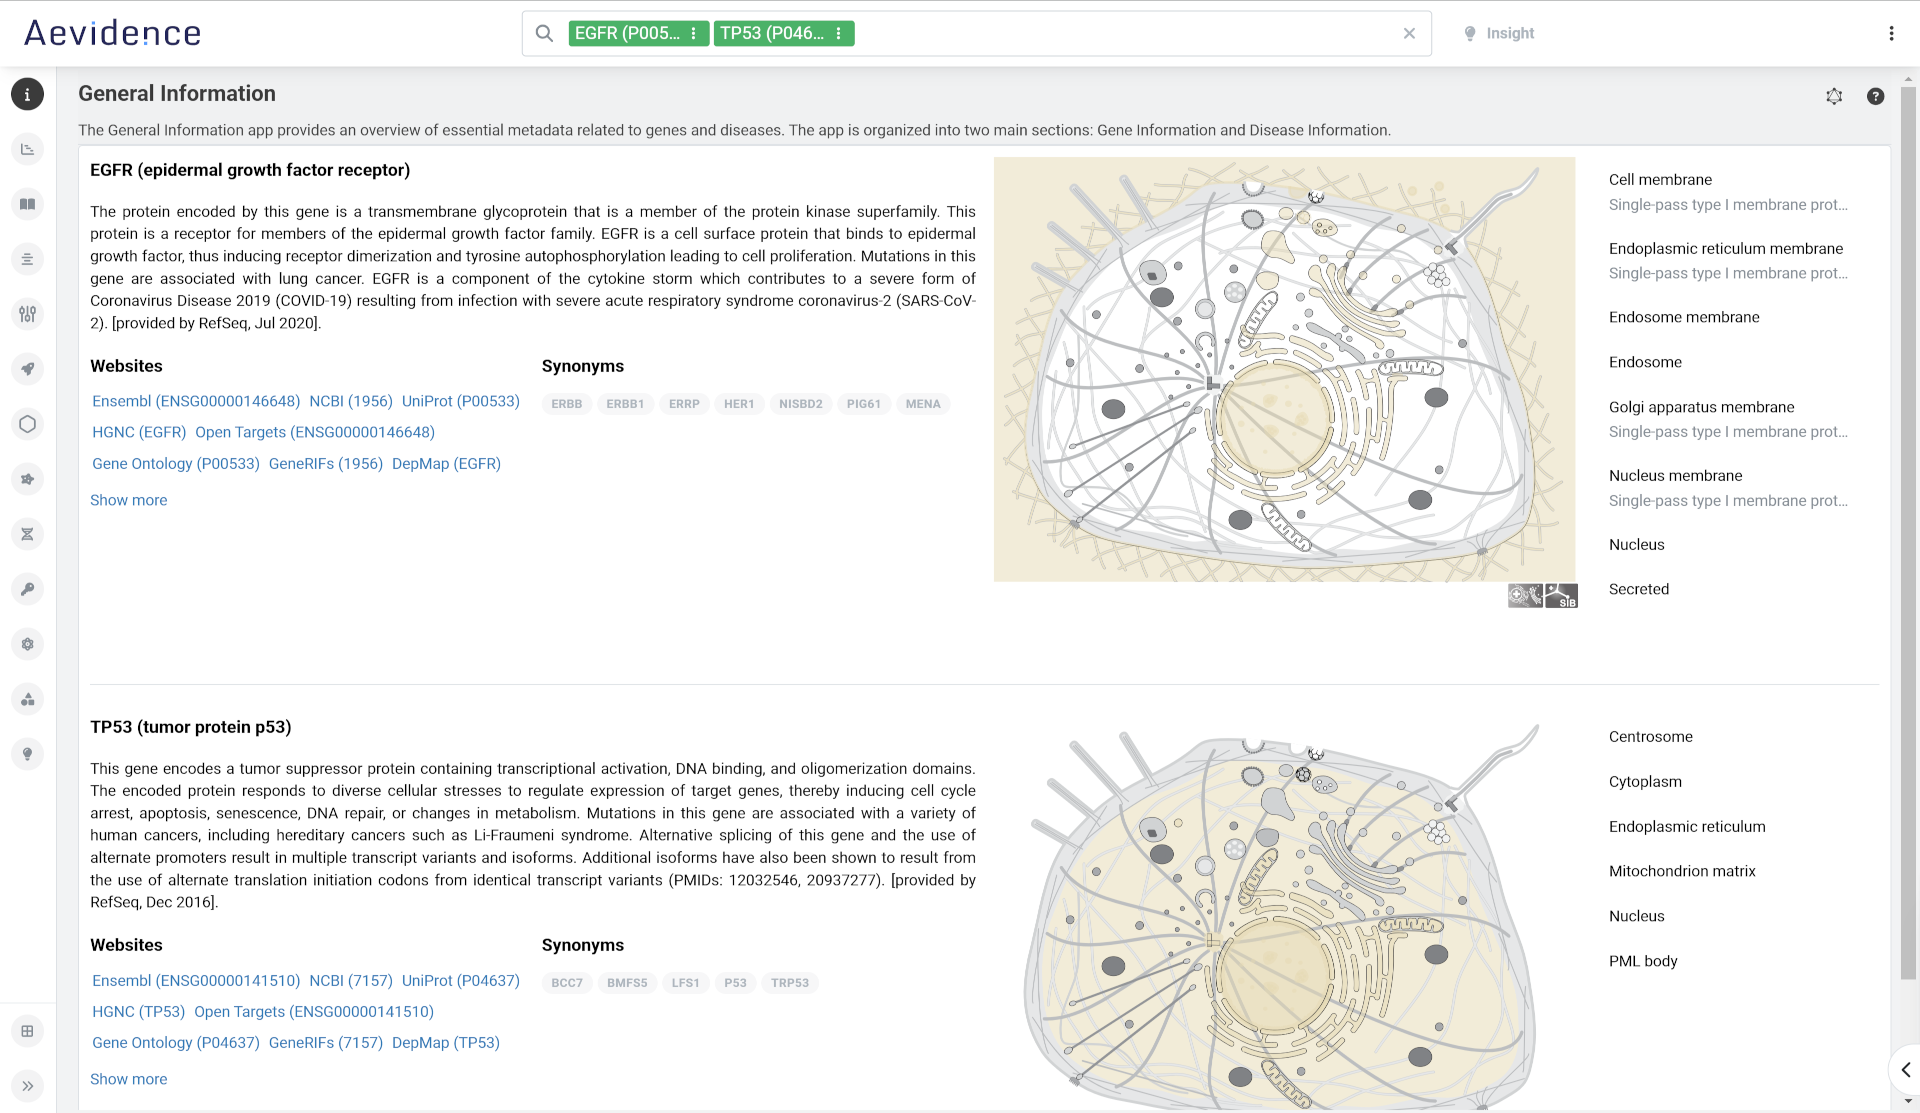
General information
Retrieve a concise summary of your genes or diseases of interest and their function. For genes, the subcellular location view shows where within the cell a protein of interest is expressed. Click on a description to highlight the organelle in the cell diagram.
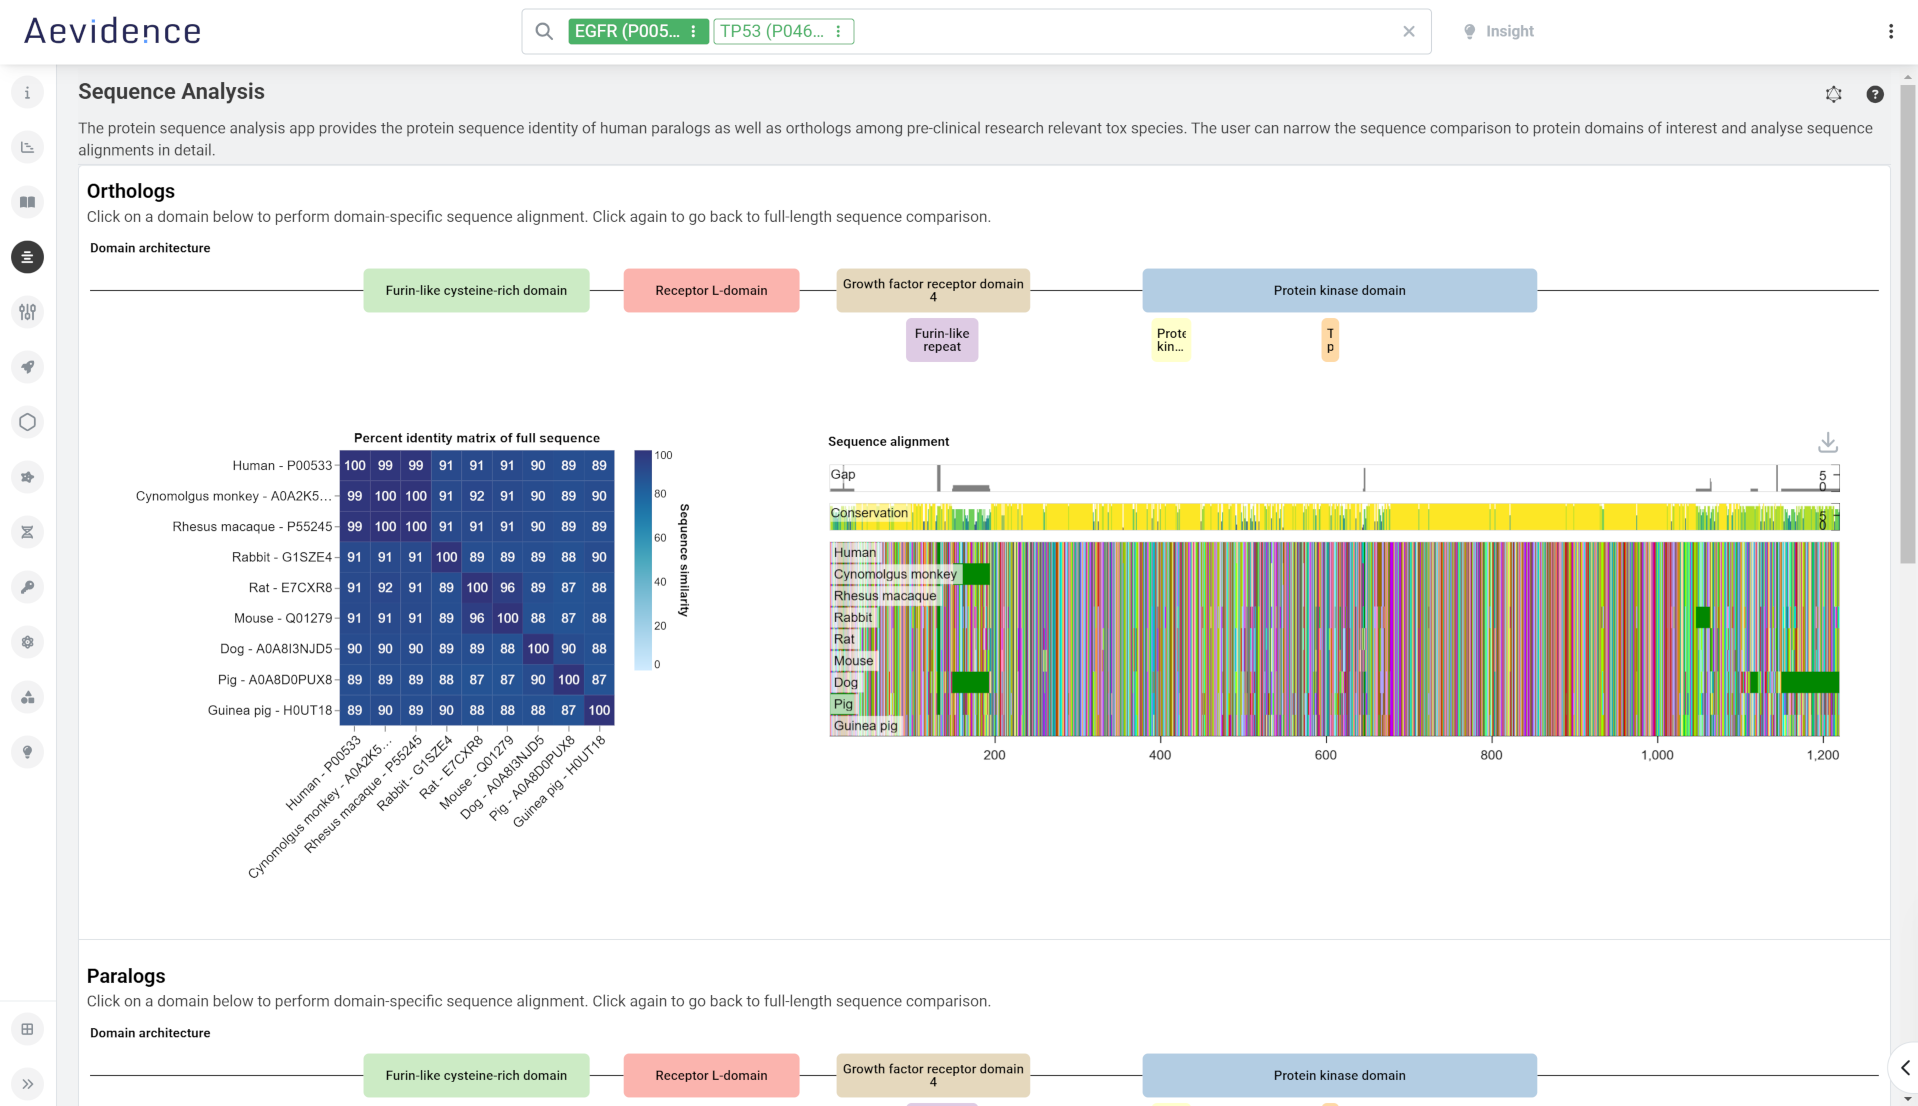
Protein sequence analysis
Retrieve protein sequence alignments between human and animal species commonly used in preclinical toxicology studies, view human gene orthologs and homologous human proteins, and run multiple sequence alignments focused on protein domains of interest.
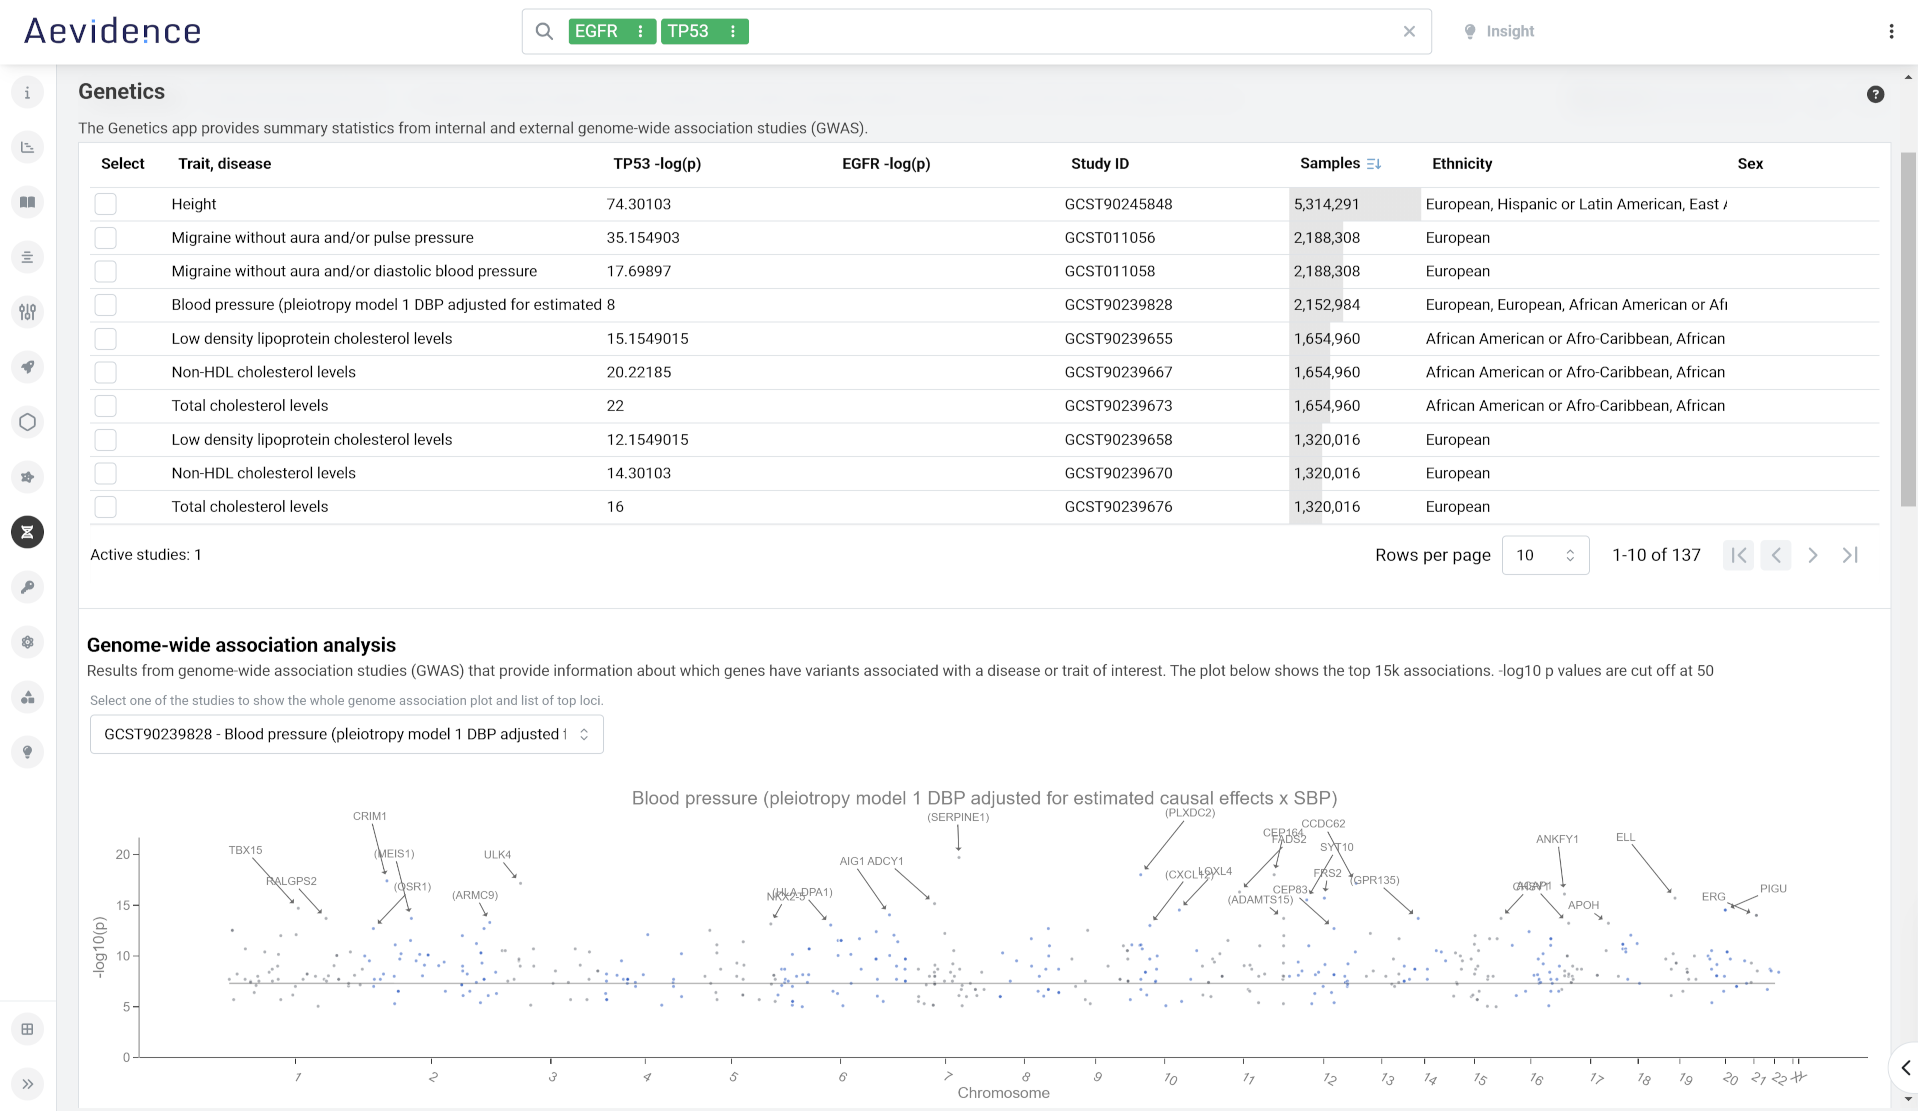
GWAS and PheWAS studies
Get summary statistics from internal and public genome-wide association (GWAS) and phenome-wide association (PheWAS) studies, with links to publications in PubMed, and drill down to a regional association plot for any genomic range.
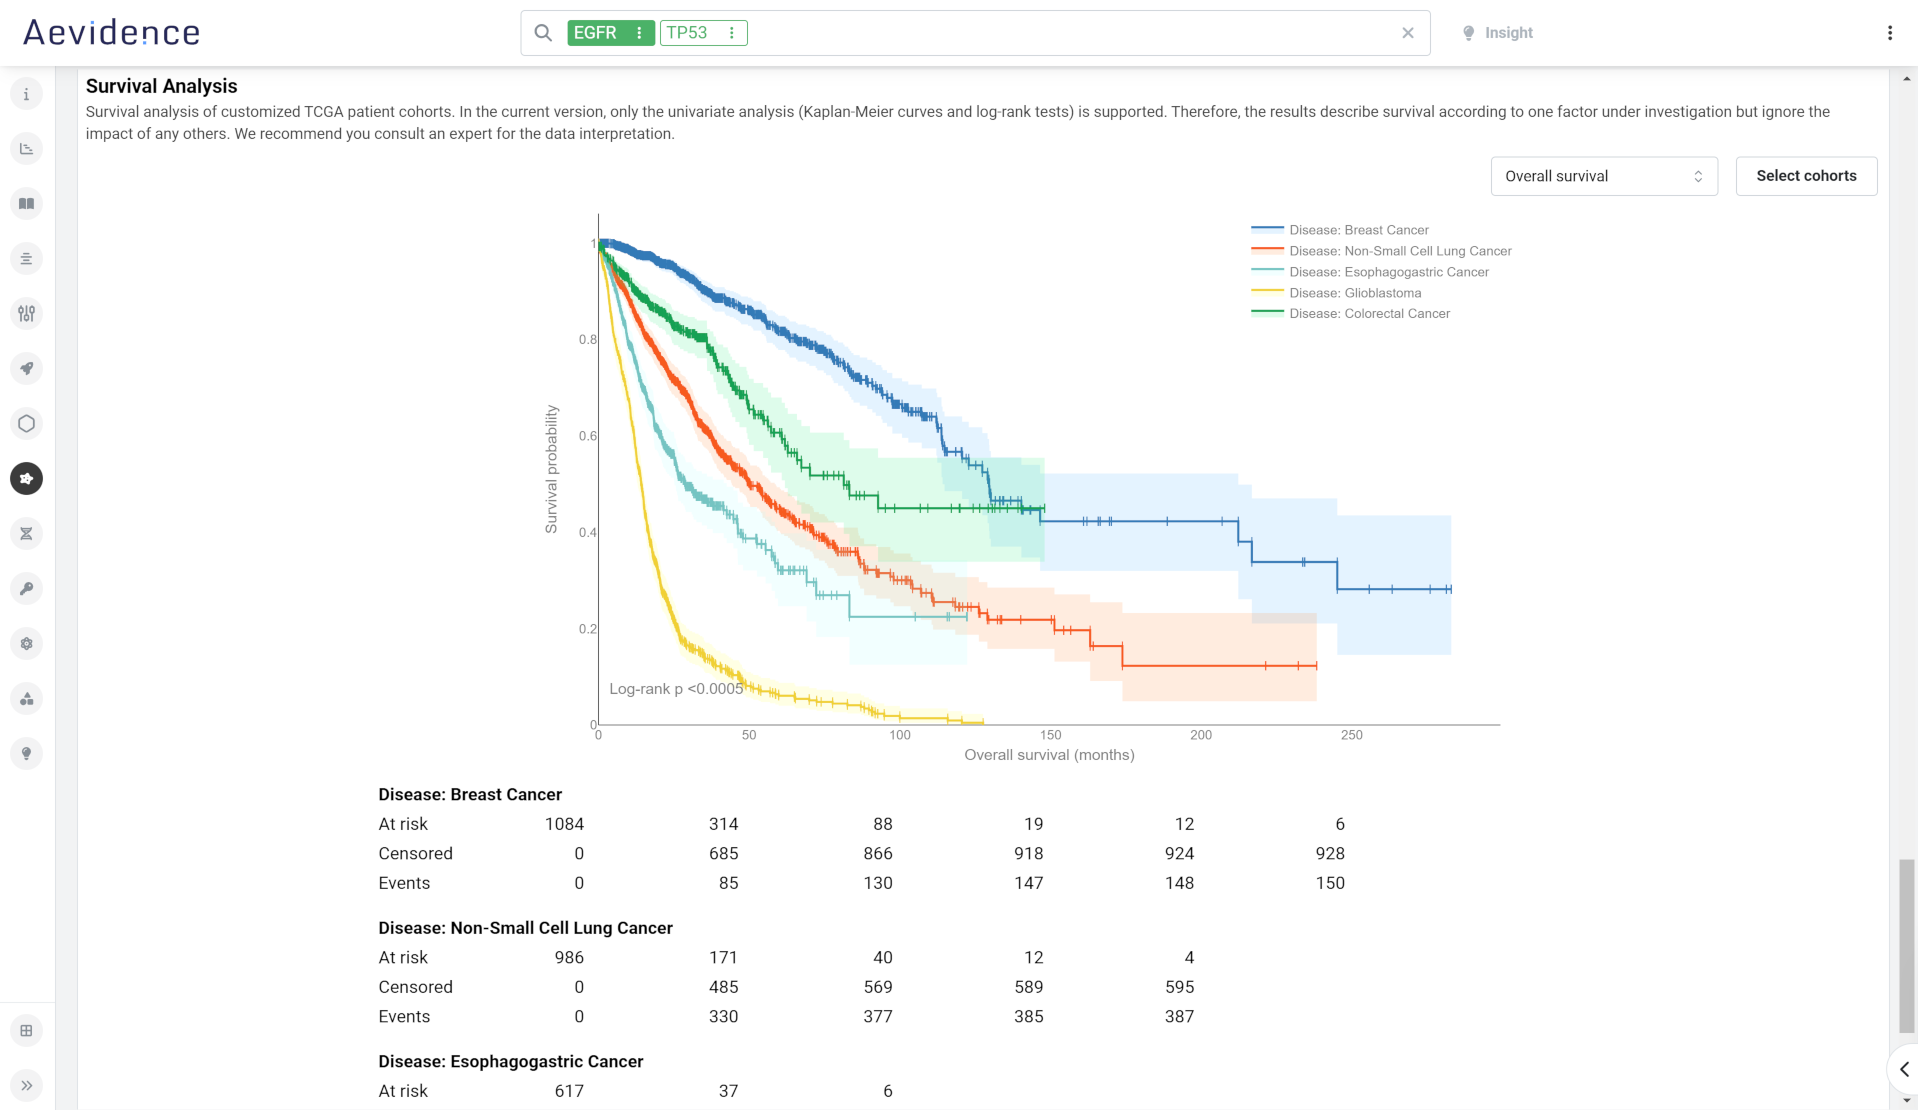
Oncology
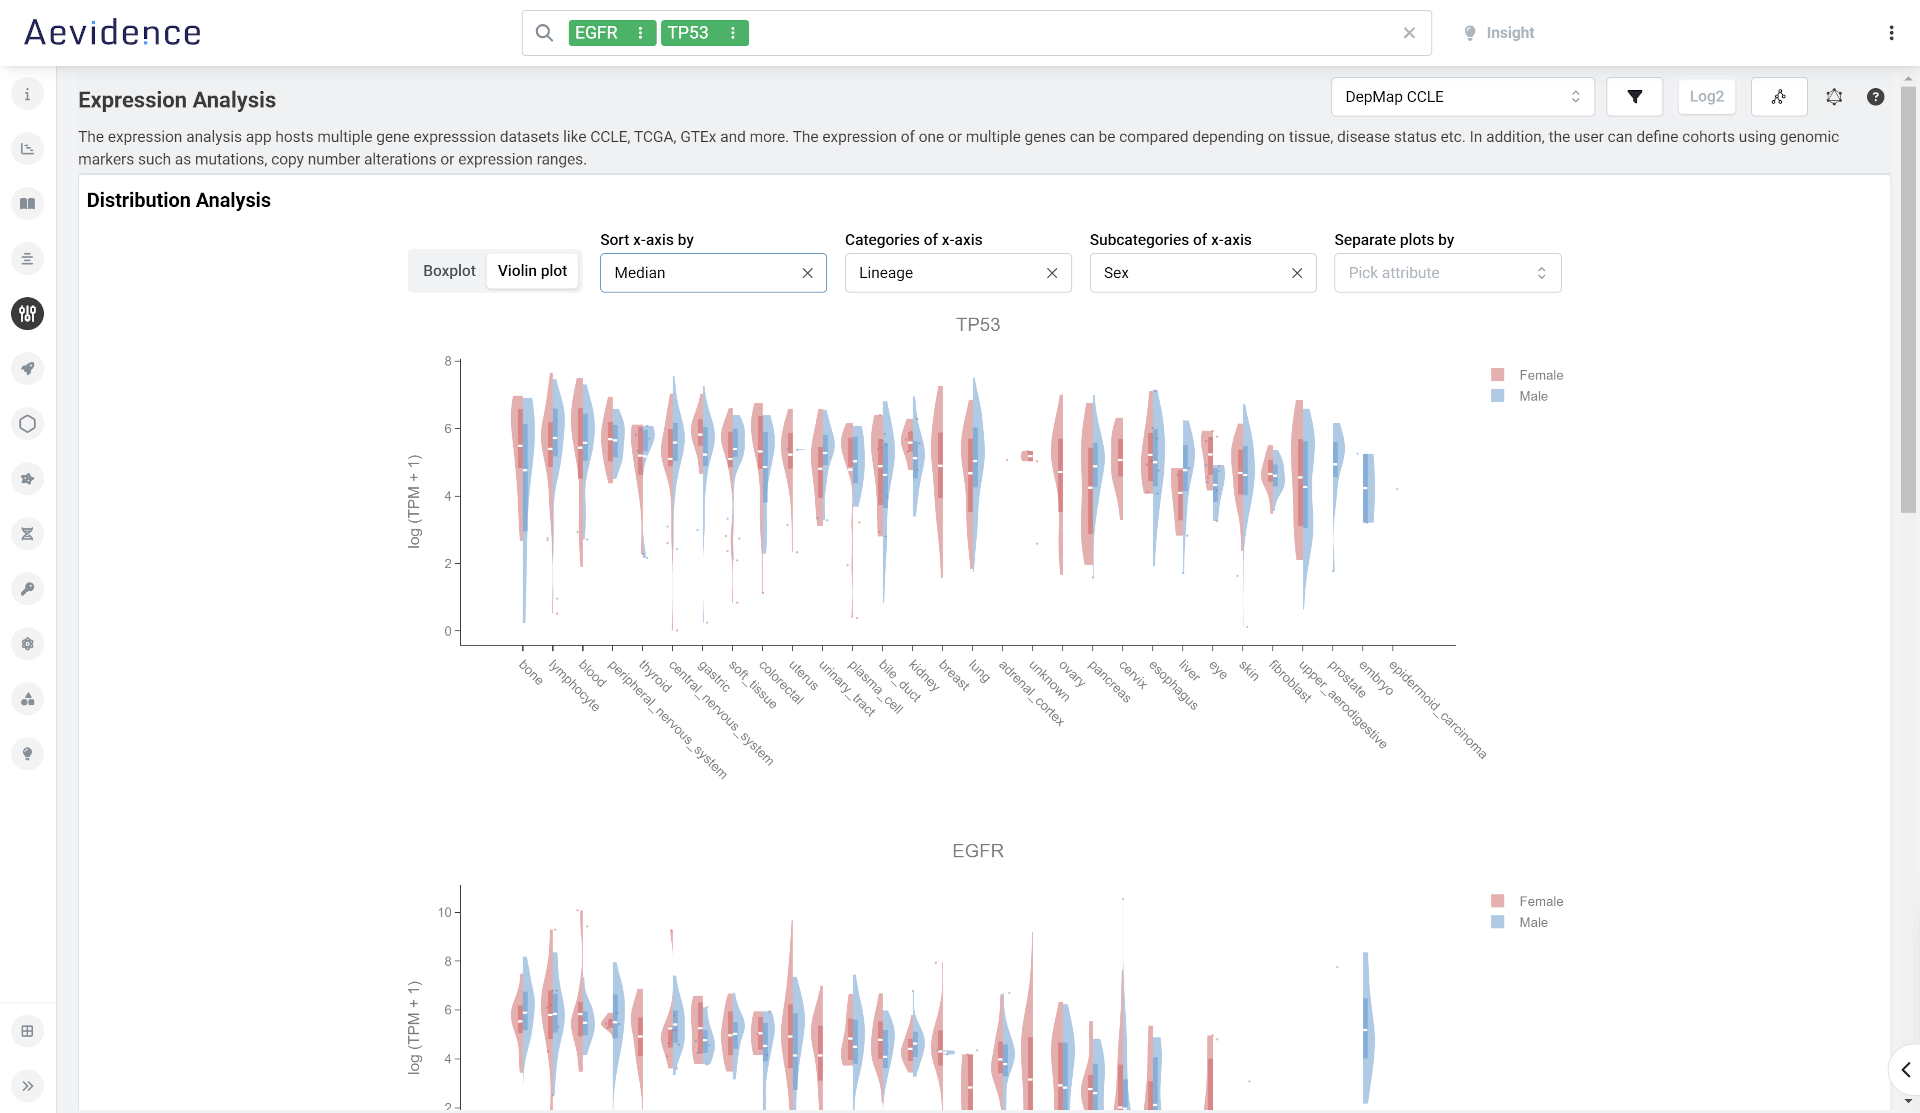
Access a visual overview of genomic alterations documented in The Cancer Genome Atlas (TCGA): alteration prevalence by cancer type, expression in tumor and normal samples, missense mutation hotspots, gene effect scores from DepMap, and survival analyses for selected patient cohorts.
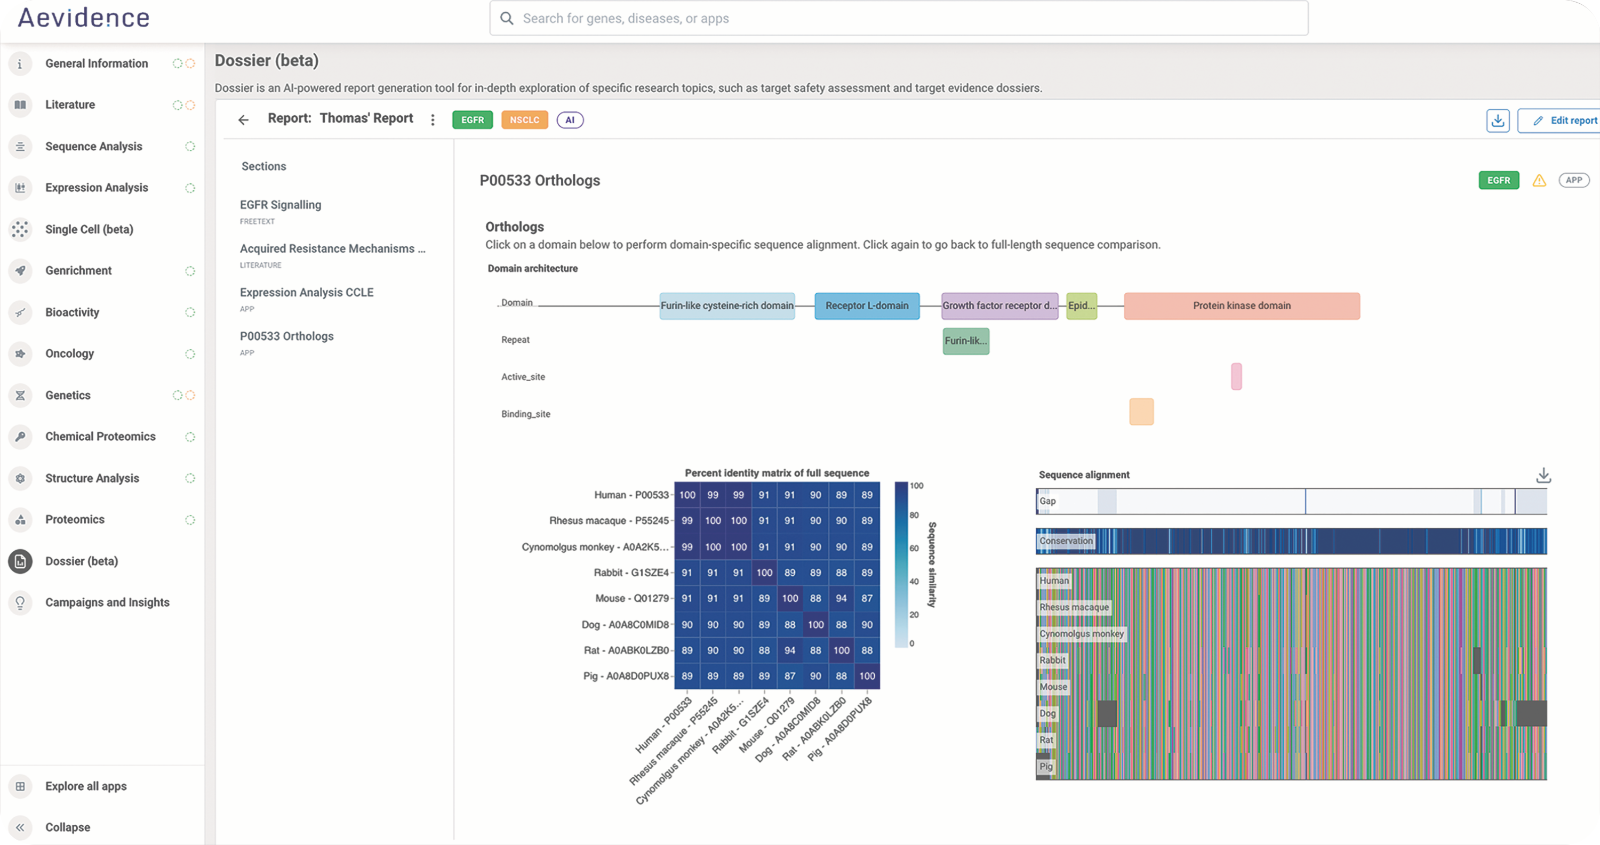
Dossier
AI-powered reporting that turns fragmented R&D data into decision-ready dossiers, combining cited literature AI, live plots from Aevidence and Ordino, and collaborative rich text.
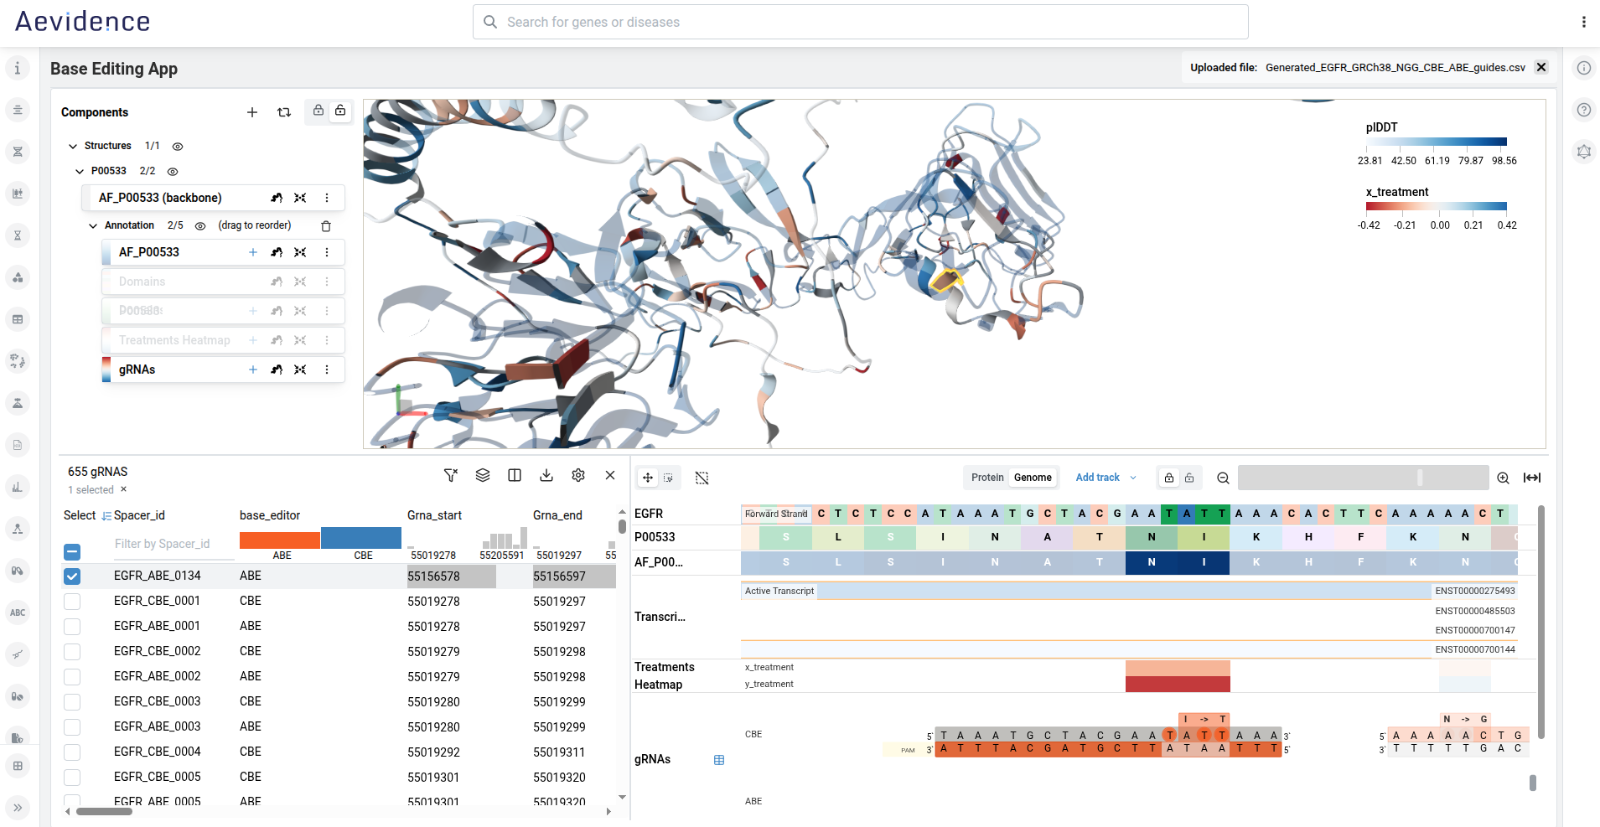
CRISPR base editing
Map and interpret gRNA spacer regions and editing outcomes across genomic coordinates, protein sequence, and 3D structure, enriched with public data from visynData.
Develop your own Aevidence app
Work with us to build an app tailored to your requirements and discovery data landscape.
Discover agentic visual intelligence
Human-AI collaboration across the R&D lifecycle. Aevidence works with your AI co-scientists, with rich, interactive visuals instead of text and static plots.
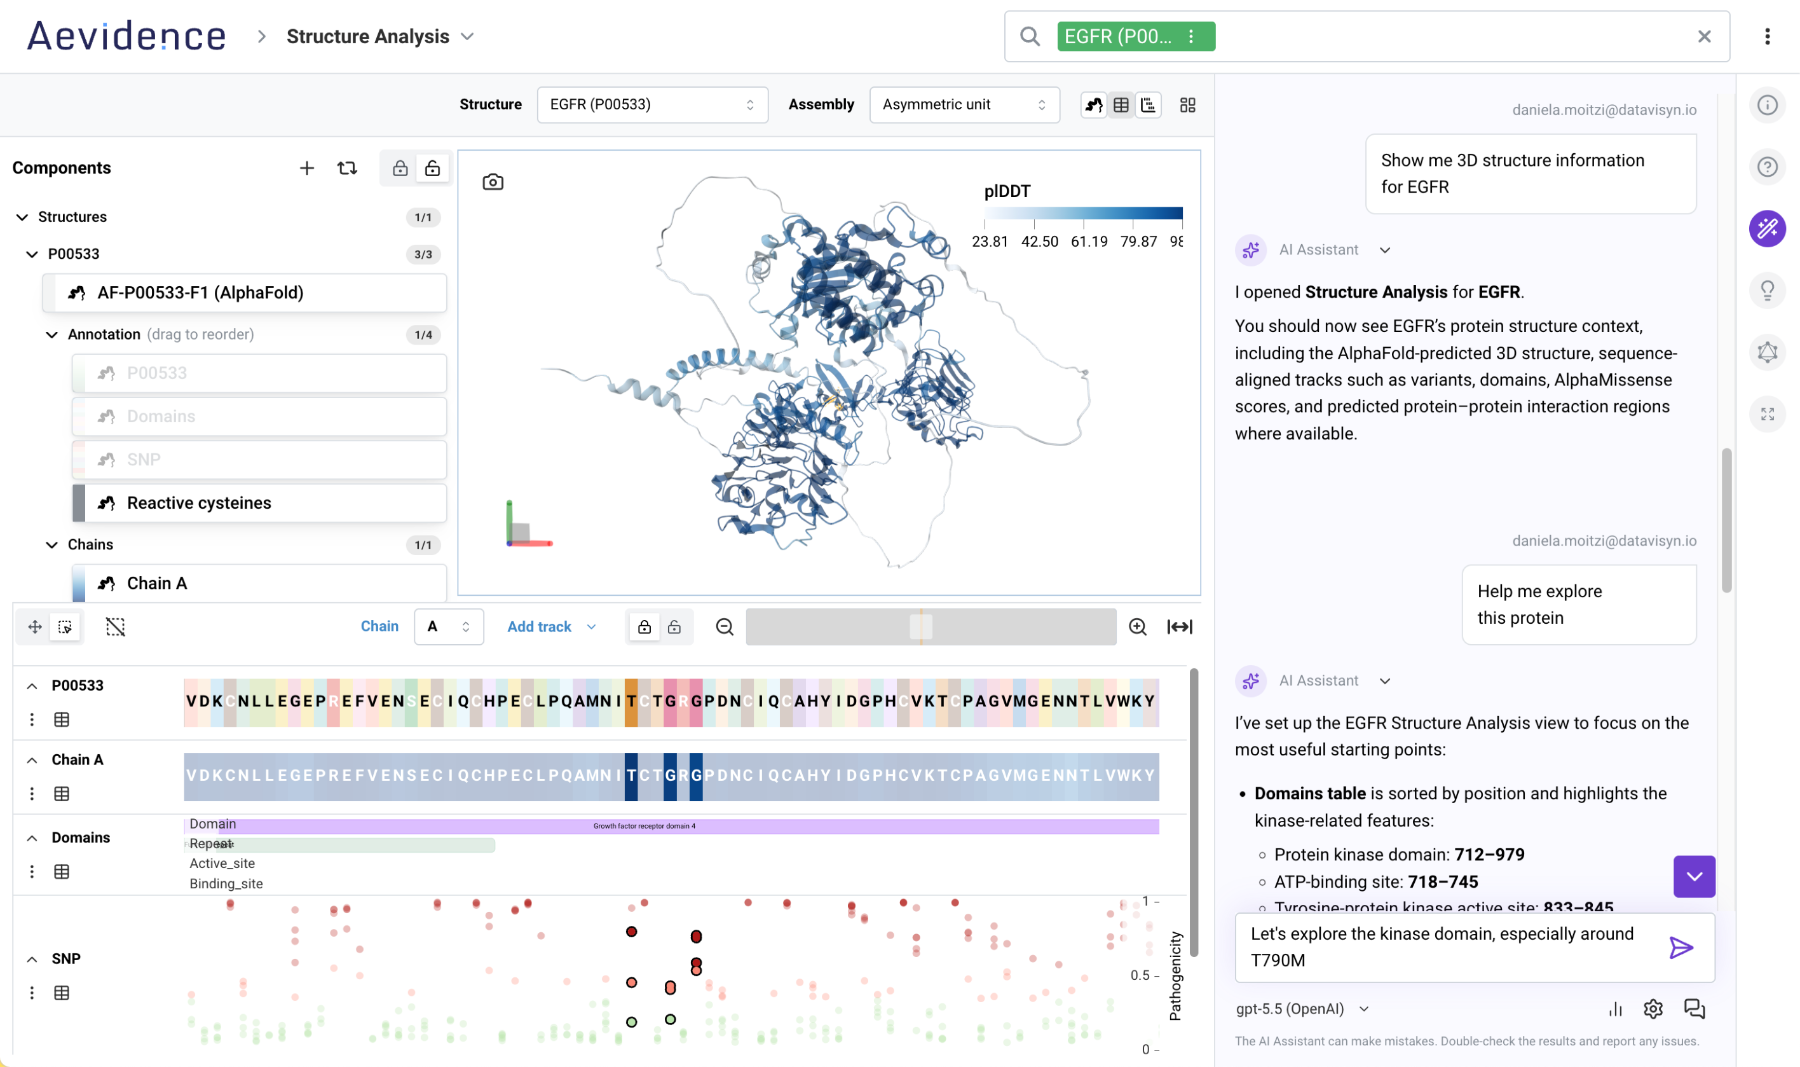
Shown: the Structure analysis app for EGFR, with the in-app AI assistant.
An embedded in-app assistant inside Aevidence helps researchers discover features and execute workflows using natural language, keeping human expertise in full control.
Standardized Model Context Protocol (MCP) layers connect datavisyn tools directly to agents like Claude and Copilot, which render fully functional, interactive visual components inside the chat window.
Visual audit trails and transparent decision provenance let human teams and AI co-scientists cross-check outputs and answer deep research questions together.
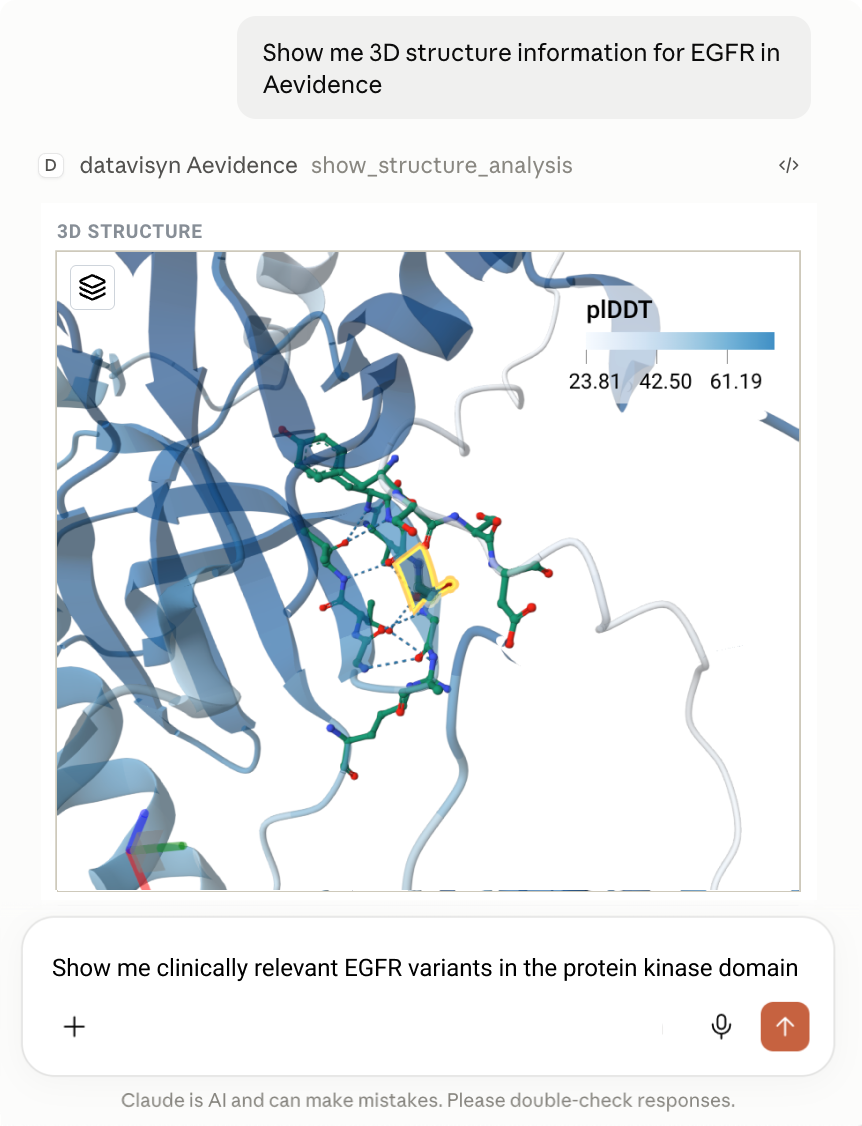
Structure analysis app in Claude via MCP-app
Researchers query complex data in plain English, manipulate live 3D structures, and automatically sync UI actions back to the model.
- Live embedded UI: Interactive 3D and scatter plots directly inside chat
- Two-way state sync: Real-time UI selections steer downstream AI reasoning
- Frictionless discovery: Connect enterprise LLMs without hitting dead ends
All the evidence you need
Integrated biomedical intelligence
Aevidence and Ordino both draw on visynData, which integrates more than 80 public sources and data repositories, including UniProt, GTEx, ChEMBL, Reactome, cBioPortal, DepMap, and TCGA. We curate and update it regularly.
Import tools make it easy to add your in-house experimental data, and we work with customers to prioritize new sources for future updates.